

#18 - 2025
Our year in a data driven world, literally!
As the end of the year approaches, we all seem to slip into a heightened emotional state. Things wrap up; other things hover on the verge of beginning. The business world demands closure, while the social space prescribes annual reports — circulated across private and public channels, clogging inboxes with charts and statements meant to signal transparency and accountability to clients, employees, and shareholders alike. And while we still believe in the cleansing promise of the debrief, we also quietly join the ranks of the eye‑rollers when faced with data‑jammed PDFs, thick with bright colors and bold black fonts. Because it’s 2025, and “predictions” appear to have reached their self‑fulfilling phase. Reports and forecasts no longer describe a possible world — they increasingly are the world. Metrics don’t point forward anymore; they sit heavily in the present, insisting on their own inevitability.
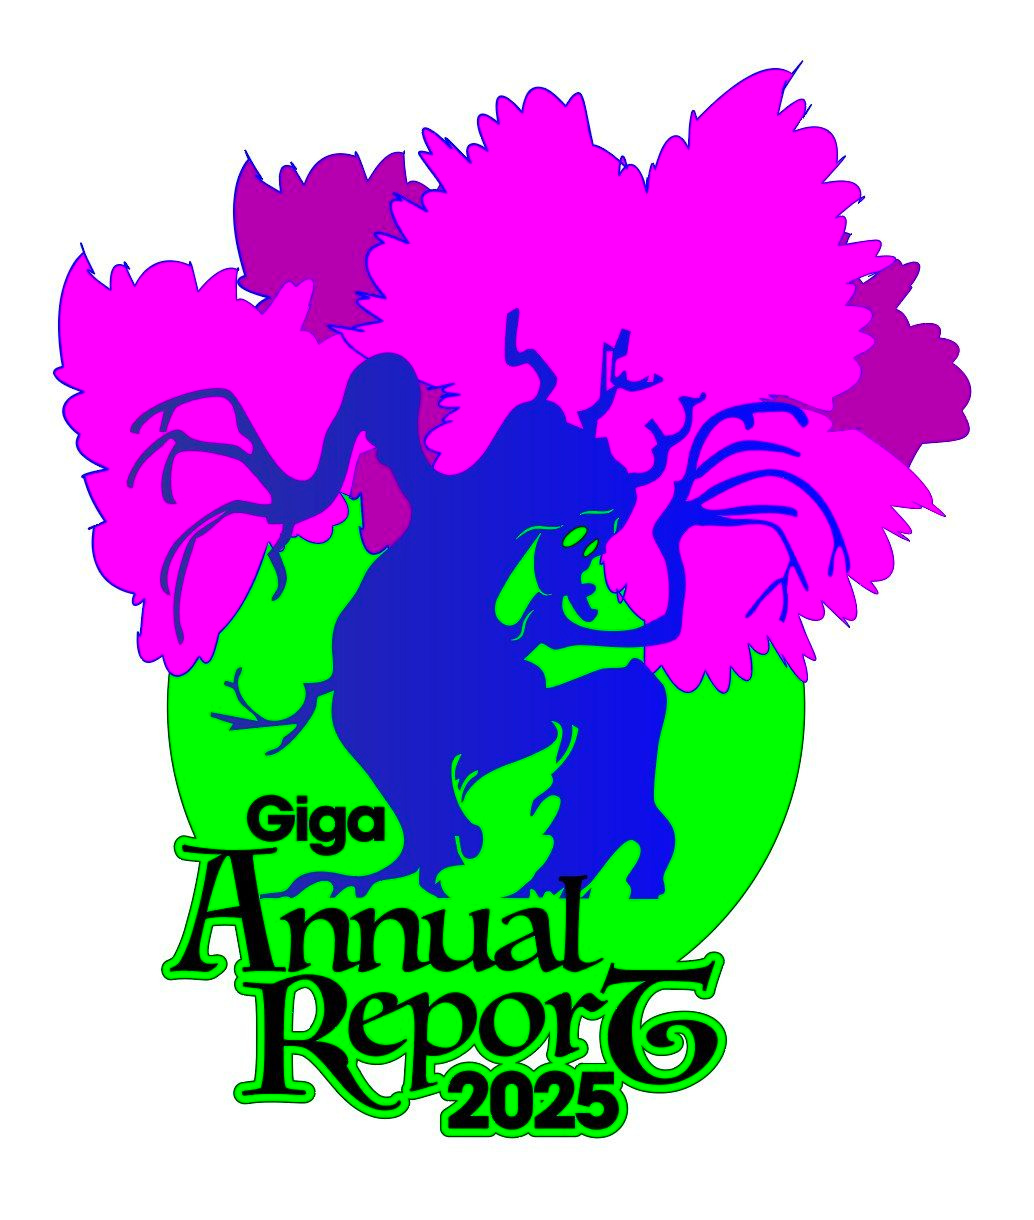
So this year, as we greet you at the end of this final quarter — or as the sun prepares, once again, to become the center of earthly rotation — we decided to give our yearly résumé a shapeshifting lift. As a small good deed, we chose not to send you yet another growth‑affirming deck of metrics, but the reality those stats have already produced. We turned our Annual Report into a world. A game, technically. One that still respects the original format: reassuring, structured, intentionally not too entertaining. After all, if you’ve worked with us before — or if you’re a friend, a fan, or decidedly not a shareholder — you already know how we tend to treat our data. Like everyone else does: carefully.
Navigating these 9 years of activity, we came to a plain conclusion: running a design company has as much to do with management as it does with design itself. Arranging schedules, sending invoices, writing quotes, overseeing timelines, establishing milestones, paying rent, calculating margins — these operations shape our work just as much as the quality of what we produce. With brutal honesty toward ourselves, we realized that wanting to spend more time on good design meant accepting how essential good management actually is. So, as tool developers, we did what felt inevitable. We auto‑clientelized and built something useful for us. It’s called Giga Dash — and it’s a blessing. Giga Dash is the engine of the studio: a management system that automates our in‑house bureaucratic loop and directly affects our workflow and internal alignment.
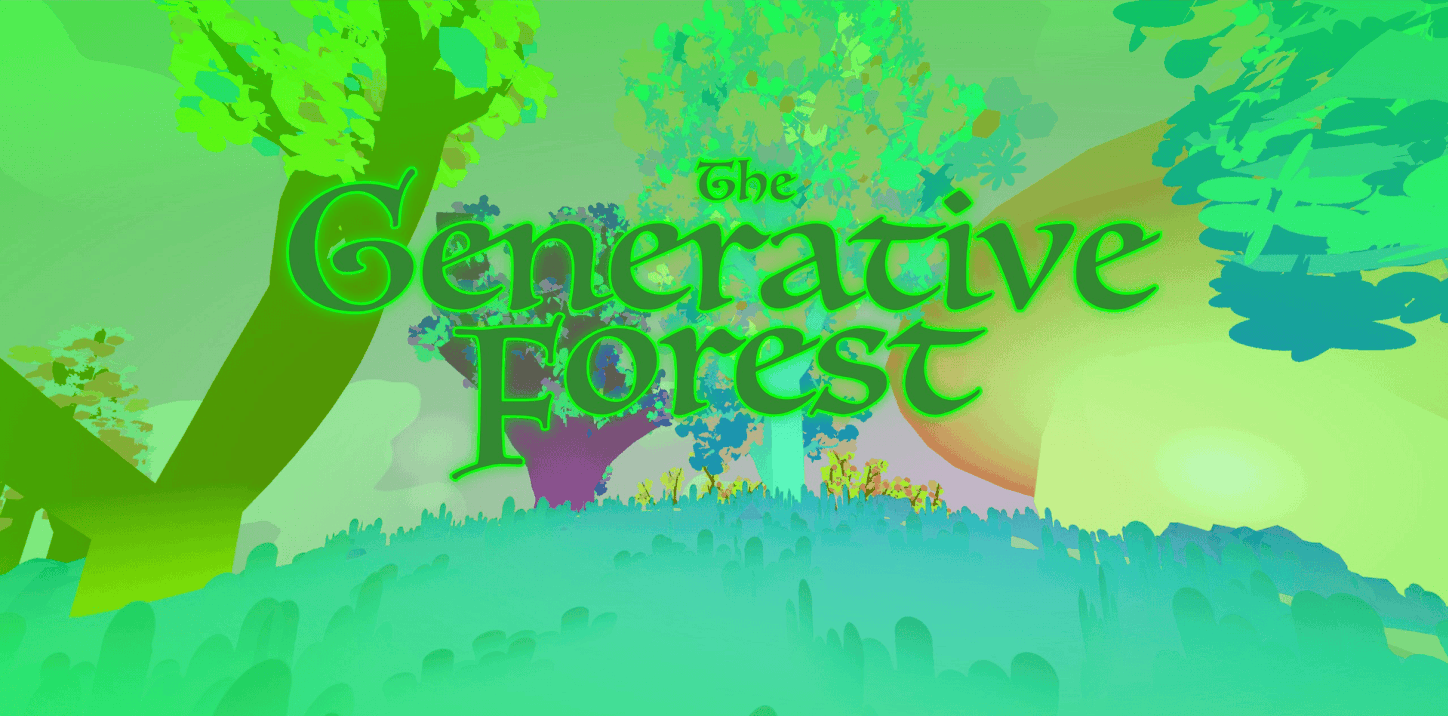
This may well be our biggest achievement this year. Not because it’s impressive on a slide, but because it carries the same quiet magic we felt when we realized we had transformed a deep necessity into an approachable, tailored solution — exactly as we try to do for our clients. And here we are: with the dash flowing beneath every project, tracking each of its aspects and returning not only beautifully designed reports, but also helping us tighten Giga’s network of thinkers and makers. This very same process sits at the core of our Annual Report. Giga Dash has been rendered, quite literally, into landscape: super‑flat trees, rocks and flowers. Data translated into terrain, shaped by the good old human hand tweaking code. Annual Report: The Gathering.
Now press Enter. Spend some time in this small, data‑driven world. Explore if you want, or simply listen to the synthetic chirping of nonexistent birds and to the stunning soundtrack of Specialedolore. Desktop only—not to exclude, but to avoid distracting you from what you should really enjoy at this time of year: some well‑deserved holidays. Not in a low‑poly world. But in a hyper‑faceted, very real one.
Hope you enjoyed :)
If you want to learn more about upcoming projects from Giga you can also follow us on Instagram and check our website.